Norton curves in p5.js
In a previous proyect, I was playing with Maurer roses, and while searching for info in Wolfram MathWorld, saw in the recomended section another cool figure, but there’s no equations.
Googling Starr Rose, I couldn’t find as much info as Maurer roses, only as an exercise to draw in calculus and geometry books.
Equations⌗
Let a, b, c
$$ 0 \leq t \leq 2\pi$$
$$x=(2+ \frac{1}{2} \sin at) \cos ( t + \frac {\sin bt}{c})$$
$$y=(2+ \frac{1}{2} \sin at) \sin ( t + \frac {\sin bt}{c})$$
So these are polar coordinates!!! The radius and angle would be
$$ r = 2 + \frac{1}{2} \sin at$$ $$ \theta = t + \frac{\sin bt}{c} $$
We can write these in p5
p5.js code⌗
  // sketch.js inside function(draw)
  const a = 9
  const b = 16
  const c = 4
  const amp = 120
  beginShape()
  strokeWeight(2);
  for (let i = 0; i <= TWO_PI + 0.001  ; i+=0.001) {
    let theta = i + (sin(b * i) / c)
    let r = amp * ( 2 + 0.5 * sin( a * i))
    let x = r * cos(theta);
    let y = r * sin(theta);
    vertex(x,y)
  }
  endShape();
Generates this figure
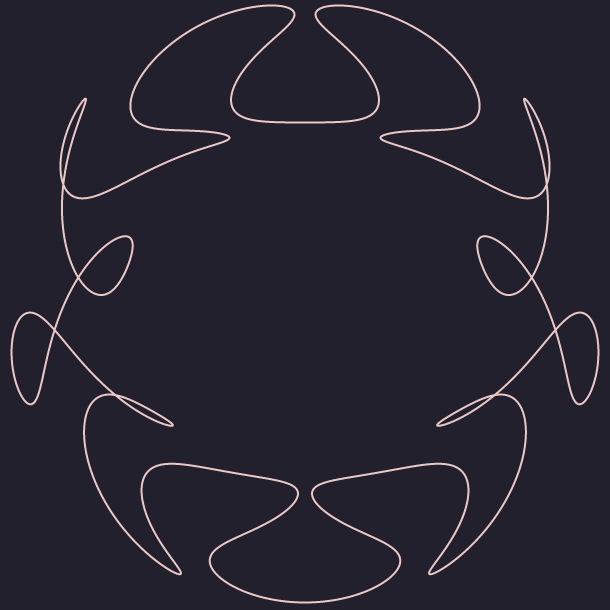
- amp is variable that amplifies the drawing, otherwise we could only see something that looks like a single point.
- With i I define the distance between the points, so in the loop I go from 0 to TWO_PI plus the interval between points
I don know about you, but this shape already makes my gears activate 🤖
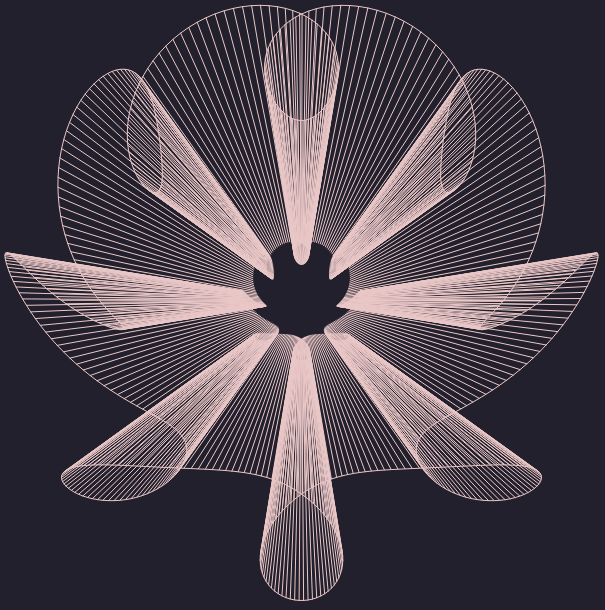
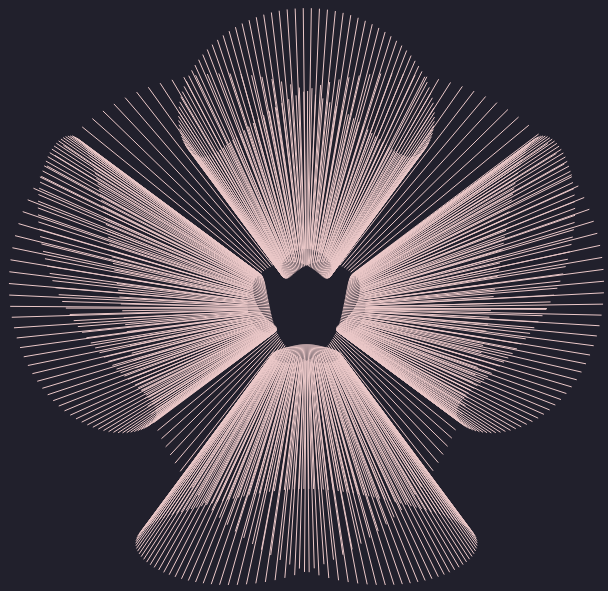
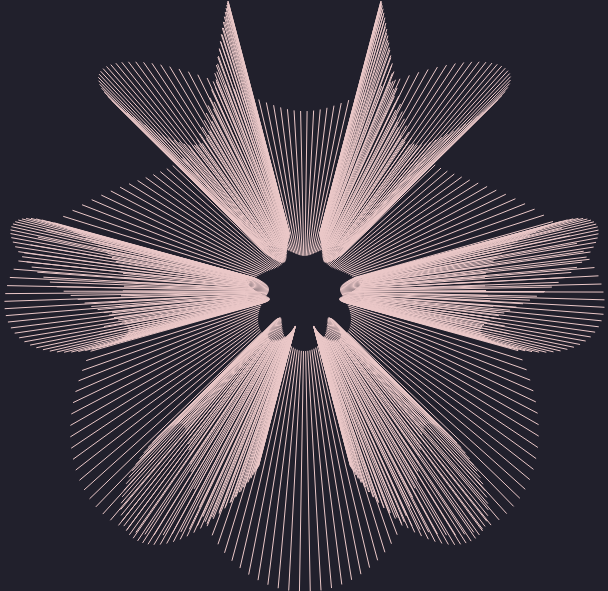
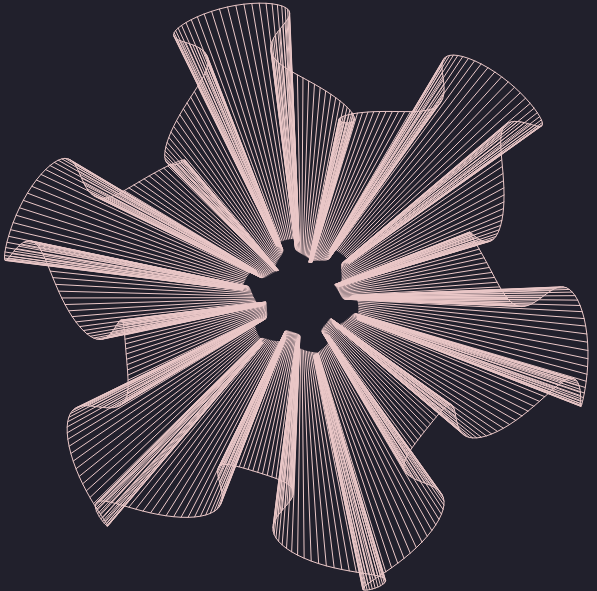
Inside Beginshape we can add lines that point to the center
  // sketch.js dentro de function(draw)
  for (let i = 0; i <= TWO_PI ; i+=0.009) {
    let theta = i + (sin(b * i) / c)
    let r = amp * ( 2 + 0.5 * sin( a * i))
    let x = r * cos(theta);
    let y = r * sin(theta);
    vertex(x,y)
    line(x*0.2, y * 0.2, x, y)
  }
That generates
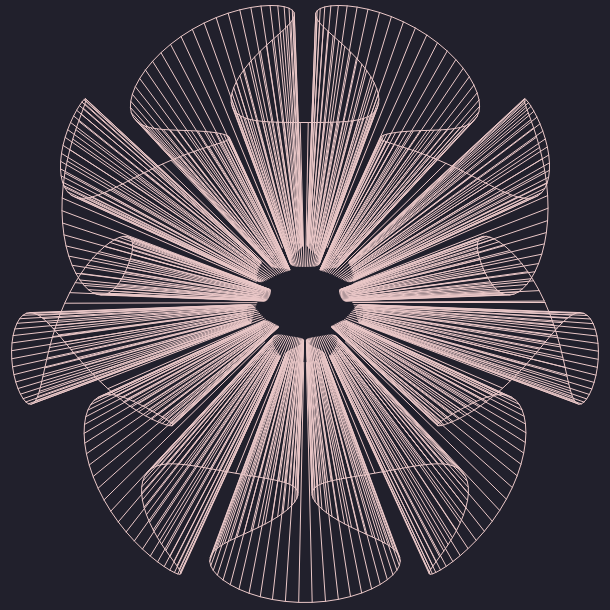
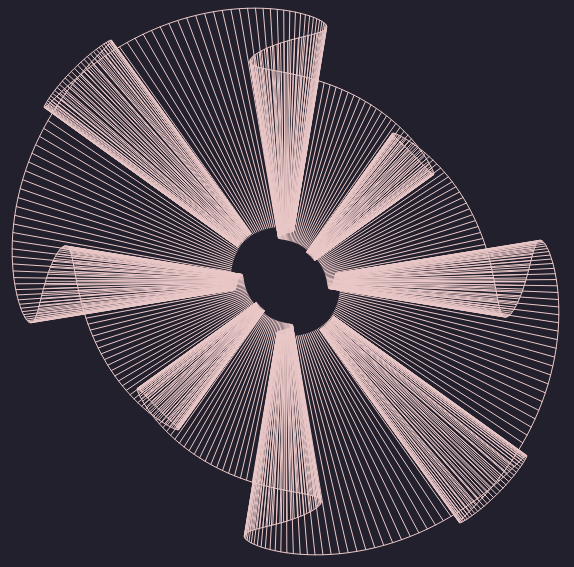
You can play a lot changing a, b and c, and because the sinodal behavior, it’s kind of difficult to predict the final shape; with every test I was surprised by the final shapes! ✨
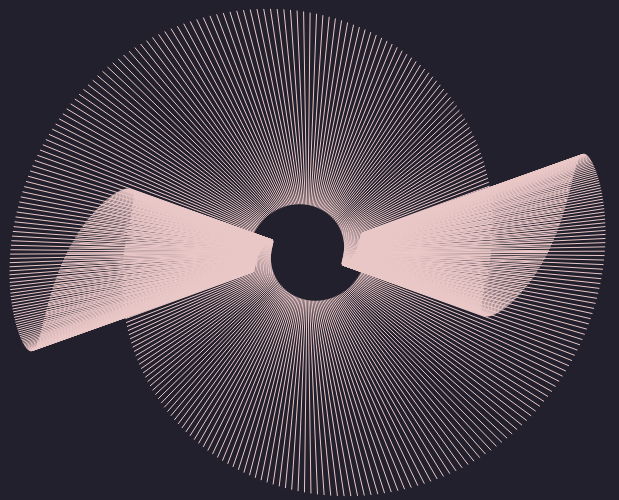
I hope you play with the code, if you created something cute and / or bizarre I want to see it! 🤩